

728x90
데이터 분석 표현 복습
1. Steamlit
- 데이터 과학 및 머신러닝 모델을 구축하고 웹 애플리케이션으로 쉽게 공유할 수 있도록 도와주는 파이썬 라이브러리
# 실행
# 주피터랩 - 터미널 -

streamlit run streamlit\test.py
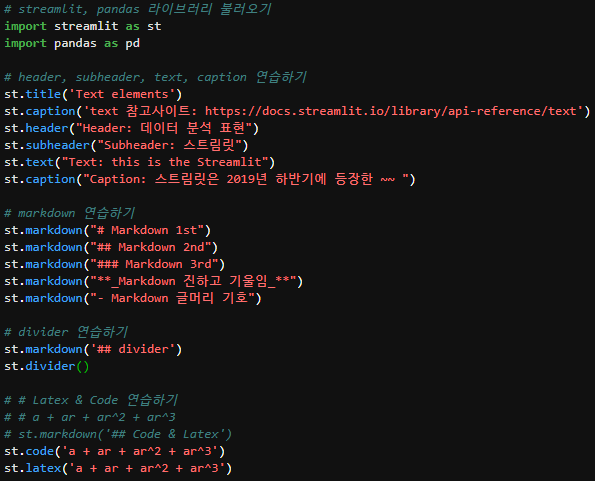
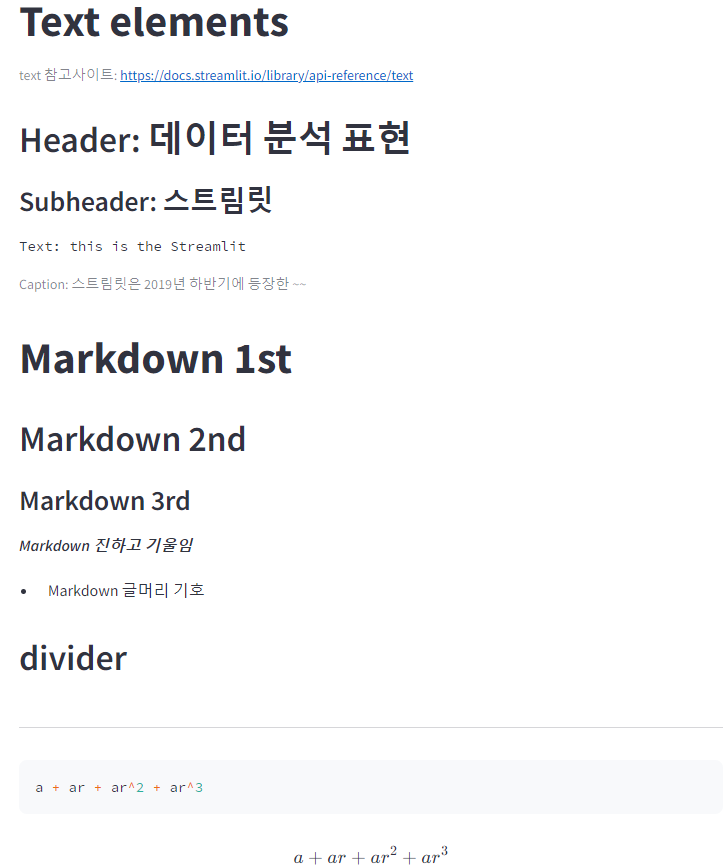
2. Text elements
import streamlit as st

# 애플리케이션의 제목 설정
st.title("My Streamlit App")

# 대제목 추가
st.header("This is a Header")

# 소제목 추가
st.subheader("This is a Subheader")

# 텍스트 추가
st.text("This is some text.")

# 다양한 유형의 객체를 표시 (문자열, 숫자, 리스트, 딕셔너리, 데이터프레임 등)
st.write("This is some text.")

# Markdown 형식으로 텍스트를 표시
st.markdown("### This is a Markdown header")

st.code

st.latex
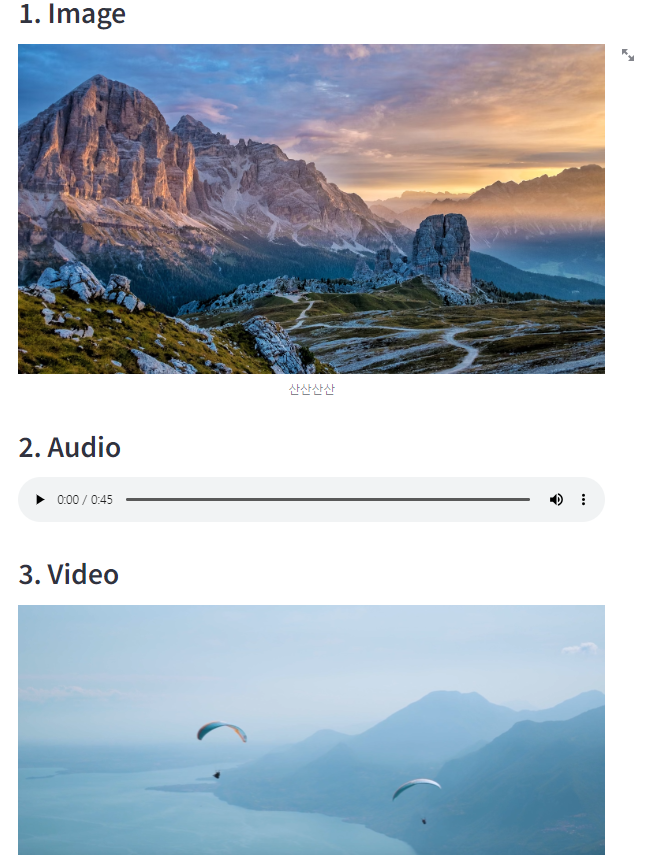
3. Media elements
st.image

st.audio

st.video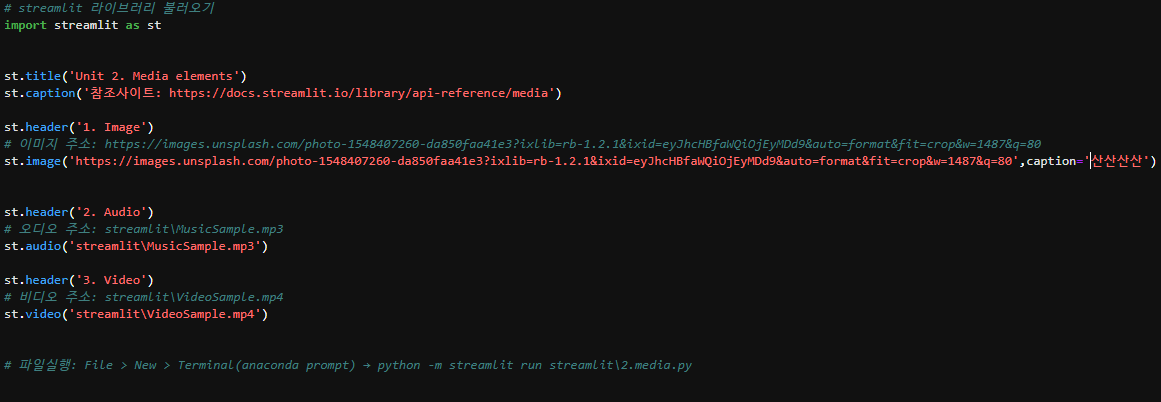
4. Data display elements
import streamlit as st
st.title('Unit 3. Data display elements')
st.caption('참조사이트: https://docs.streamlit.io/library/api-reference/data')
st.header(' 1. Metric') # °C
st.metric(label="Temperature", value="30.5 °C", delta="2.5 °C")
st.metric(label="Temperature", value="28 °C", delta="-2.5 °C")
st.header('2. columns') # °C
col1, col2, col3 = st.columns(3)
col1.metric("기온", "30.5 °C", "2.5 °C")
col2.metric("풍속", "9 mph", "-8%")
col3.metric("습도", "86%", "4%")
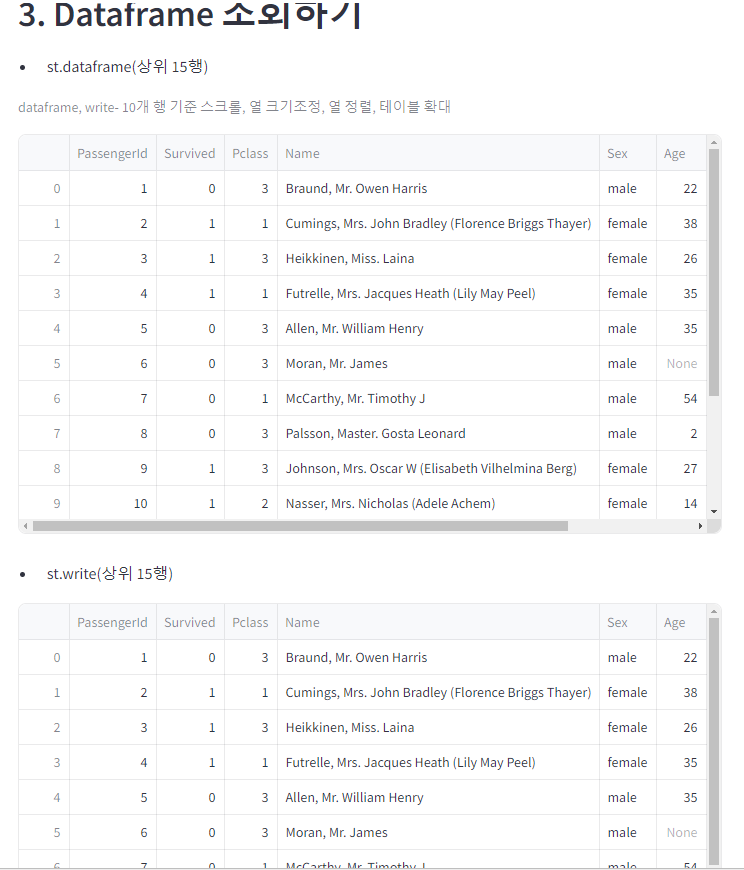
st.header('3. Dataframe 조회하기')
# 파일 위치- https://raw.githubusercontent.com/huhshin/streamlit/master/data_titanic.csv
# dataframe, write-10개행기준스크롤, 열크기조정, 열정렬, 테이블확대
titanic = pd.read_csv('https://raw.githubusercontent.com/huhshin/streamlit/master/data_titanic.csv')
st.markdown('- st.dataframe(상위 15행)')
st.caption('dataframe, write- 10개 행 기준 스크롤, 열 크기조정, 열 정렬, 테이블 확대')
st.dataframe(titanic.head(15))
st.markdown('- st.write(상위 15행)')
st.dataframe(titanic.head(15))
st.markdown('- st.table(상위 15행)')
st.caption('table- 형태 고정')
st.table(titanic.head(15))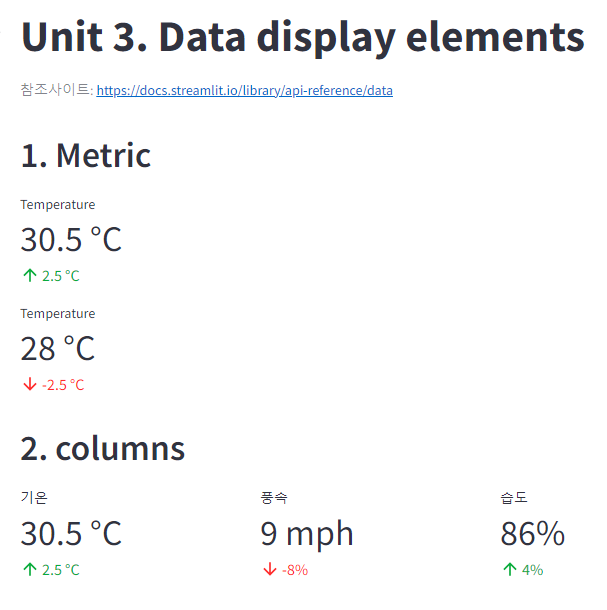
4. Input Widgets
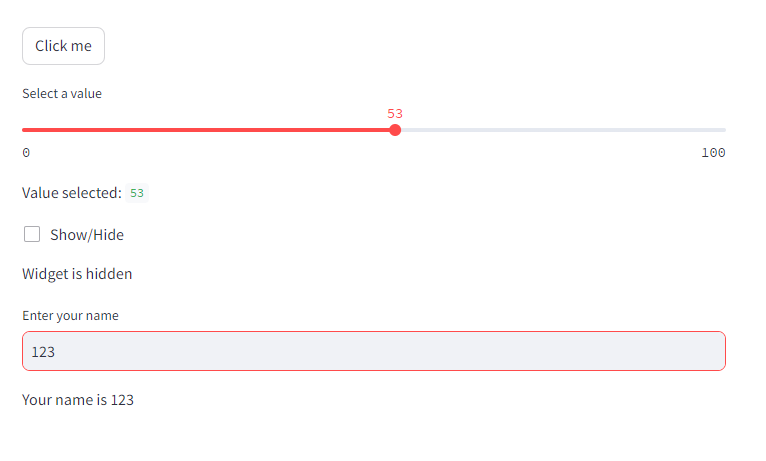
- streamlit은button, slider, widget, input 등의 widget 사용 가능
import streamlit as st

if st.button('Click me'):
    st.write('Button clicked!')

# 슬라이더 생성
value = st.slider('Select a value', 0, 100)

# 선택된 값 출력
st.write('Value selected:', value)


# 체크박스 생성
option = st.checkbox('Show/Hide')

# 선택된 체크박스 상태에 따라 텍스트 출력
if option:
    st.write('Widget is shown')
else:
    st.write('Widget is hidden')


# 입력란 생성
name = st.text_input('Enter your name', 'John Doe')

# 입력된 이름 출력
st.write('Your name is', name)
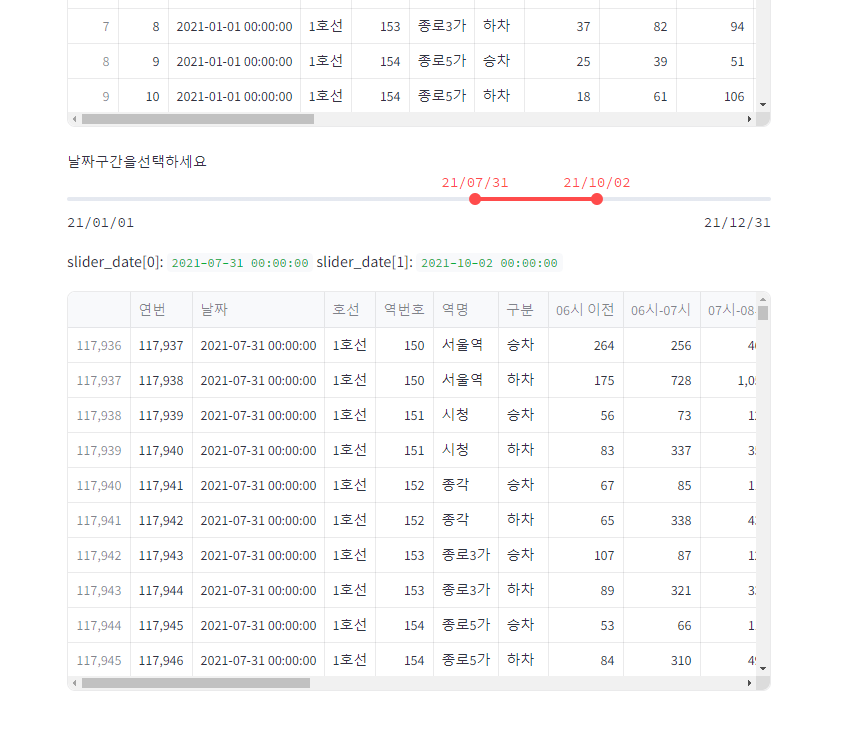
날짜 구간 데이터 조회
import streamlit as st
import pandas as pd
from datetime import datetime
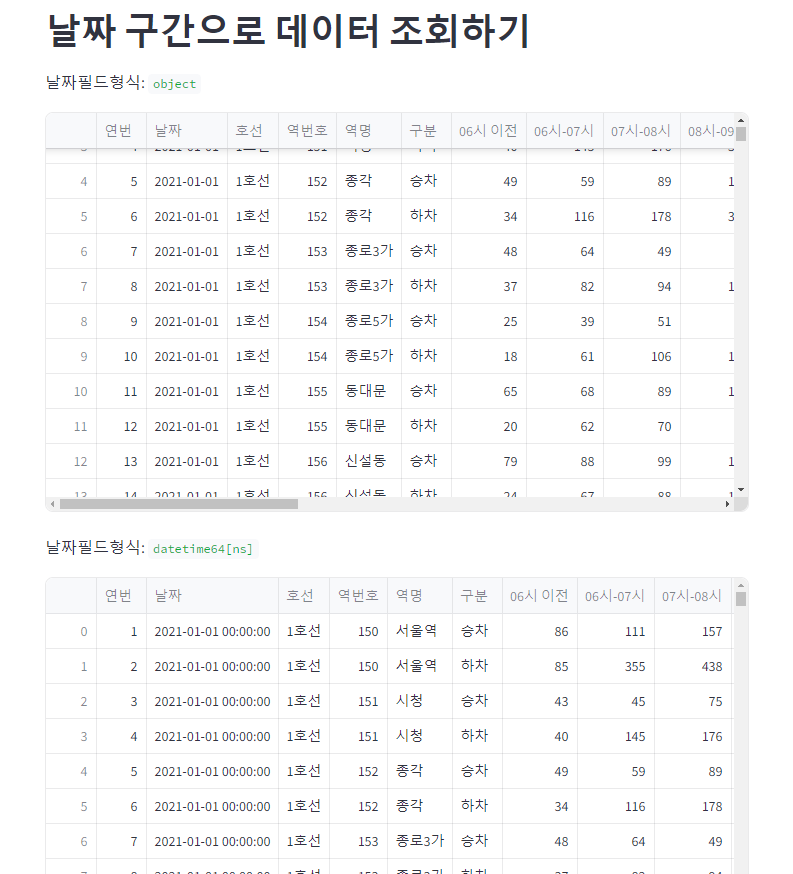
st.header('날짜 구간으로 데이터 조회하기')
df = pd.read_csv('streamlit\data_subway_in_seoul.csv', encoding='cp949')
st.write('날짜필드형식: ', df['날짜'].dtypes)
st.write(df)
# 날짜컬럼을string에서datetime으로변환하고확인하기
df['날짜'] = pd.to_datetime( df['날짜'], format='%Y-%m-%d' )
st.write('날짜필드형식: ', df['날짜'].dtypes)
st.write(df)
slider_date = st.slider(
'날짜구간을선택하세요',datetime(2021, 1, 1), datetime(2021, 12, 31),value=(datetime(2021, 7, 1), datetime(2021, 7, 31)),format='YY/MM/DD')
st.write('slider_date[0]: ', slider_date[0], 'slider_date[1]: ', slider_date[1] )
start_date = slider_date[0]
end_date = slider_date[1]
# slider 날짜구간으로df를읽어서새sel_df 으로저장하고확인하기
sel_df = df.loc[df['날짜'].between(start_date, end_date)]
st.dataframe(sel_df)
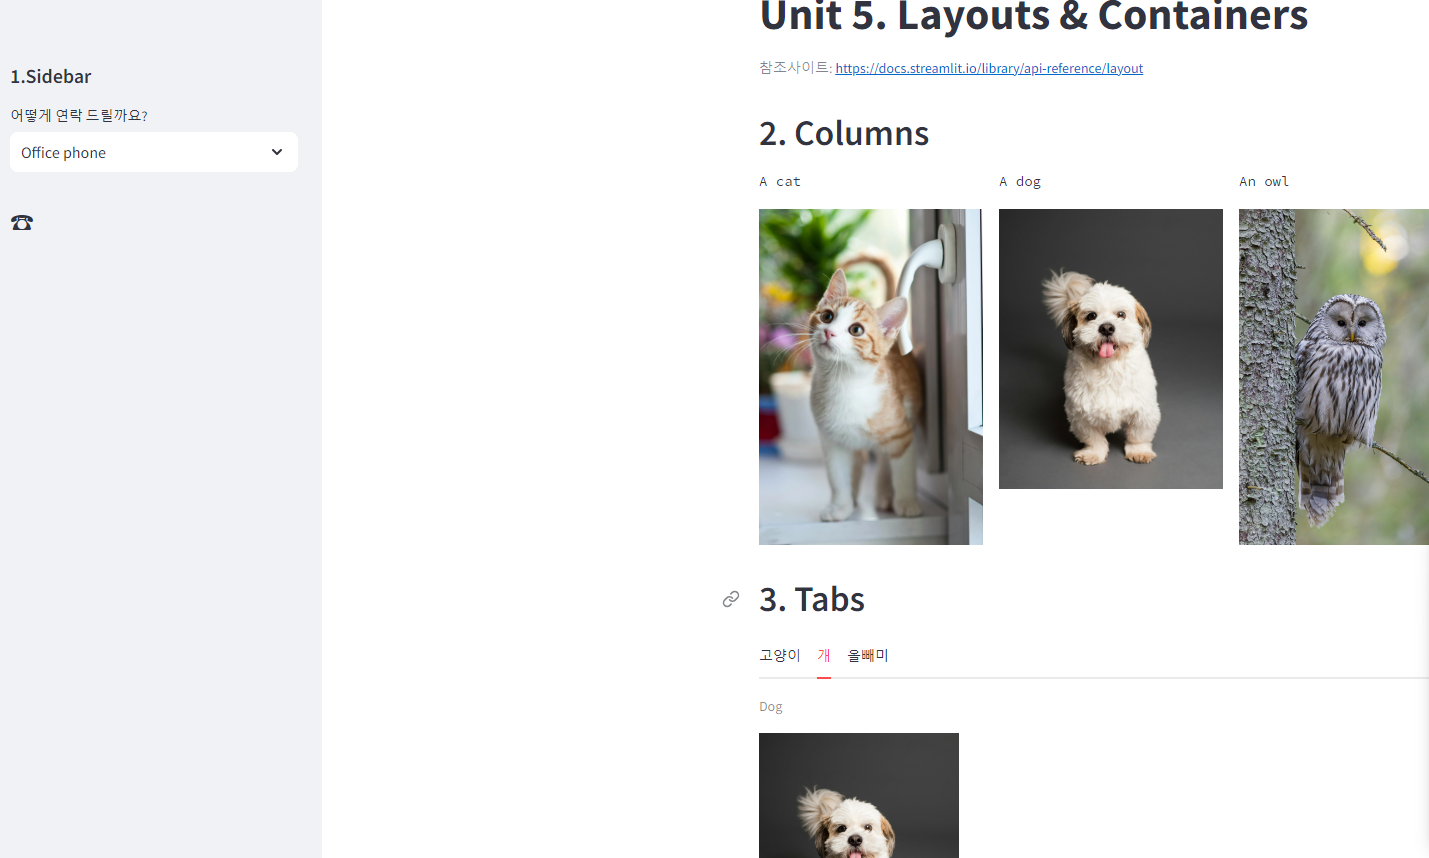
5. Layouts & Containers
import streamlit as st

st.title('Unit 5. Layouts & Containers')
st.caption('참조사이트: https://docs.streamlit.io/library/api-reference/layout')

# sidebar- with 사용하기 📧  📱  ☎︎
with st.sidebar:
    st.header('1.Sidebar')


add_selectbox = st.sidebar.selectbox('어떻게 연락 드릴까요?', ('Email', 'Mobile phone', 'Office phone'))


if add_selectbox == 'Email':
    st.sidebar.title('📧')
elif add_selectbox == 'Mobile phone':
    st.sidebar.title('📱')
else:
    st.sidebar.title('☎︎')


# columns
# 고양이 https://images.pexels.com/photos/2071873/pexels-photo-2071873.jpeg?auto=compress&cs=tinysrgb
# 개     https://images.pexels.com/photos/3361739/pexels-photo-3361739.jpeg?auto=compress&cs=tinysrgb
# 부엉이 https://images.pexels.com/photos/3737300/pexels-photo-3737300.jpeg?auto=compress&cs=tinysrgb

st.header('2. Columns')

col1, col2, col3= st.columns(3)
with col1:
    st.text('A cat')
    st.image('https://images.pexels.com/photos/2071873/pexels-photo-2071873.jpeg?auto=compress&cs=tinysrgb')

with col2:
    st.text('A dog')
    st.image('https://images.pexels.com/photos/3361739/pexels-photo-3361739.jpeg?auto=compress&cs=tinysrgb')

with col3:
    st.text('An owl')
    st.image('https://images.pexels.com/photos/3737300/pexels-photo-3737300.jpeg?auto=compress&cs=tinysrgb')


# tabs - width=200

st.header('3. Tabs')

tab1, tab2, tab3= st.tabs(['고양이', '개', '올빼미'])

with tab1:
             st.caption('Cat')
             st.image('https://images.pexels.com/photos/2071873/pexels-photo-2071873.jpeg?auto=compress&cs=tinysrgb' , width=200)

with tab2:
             st.caption('Dog')
             st.image('https://images.pexels.com/photos/3361739/pexels-photo-3361739.jpeg?auto=compress&cs=tinysrgb' , width=200)

with tab3:
             st.caption('Owl')
             st.image('https://images.pexels.com/photos/3737300/pexels-photo-3737300.jpeg?auto=compress&cs=tinysrgb', width=200)
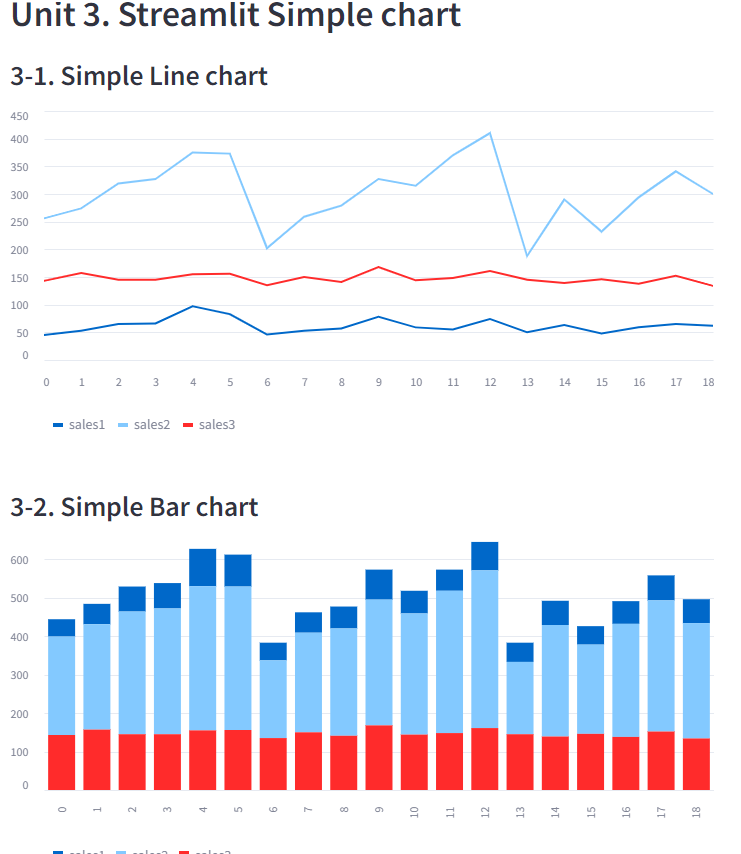
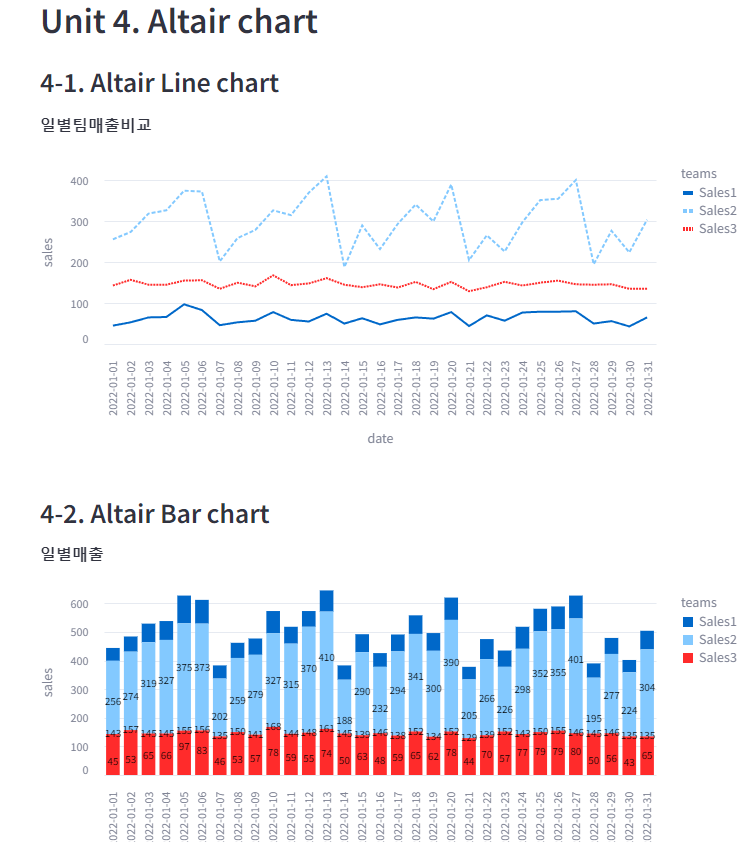
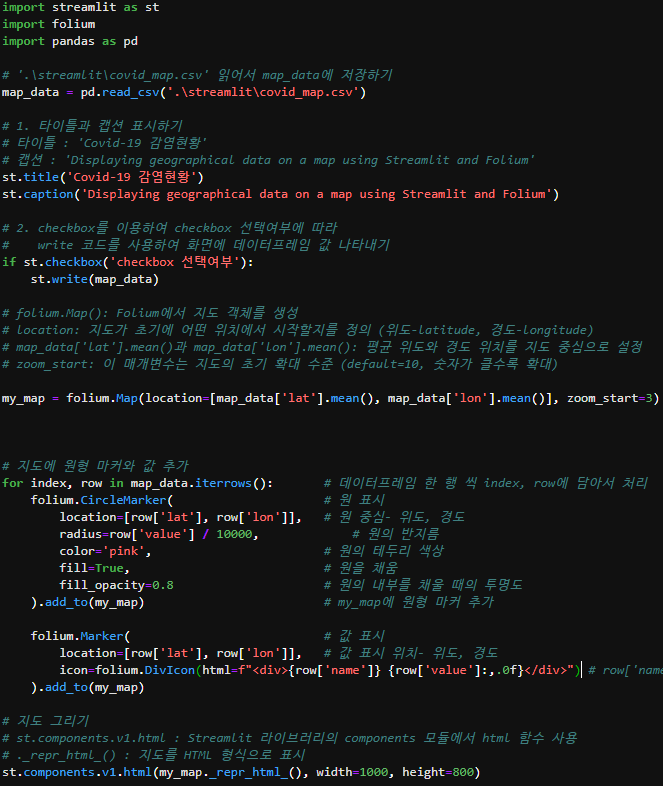
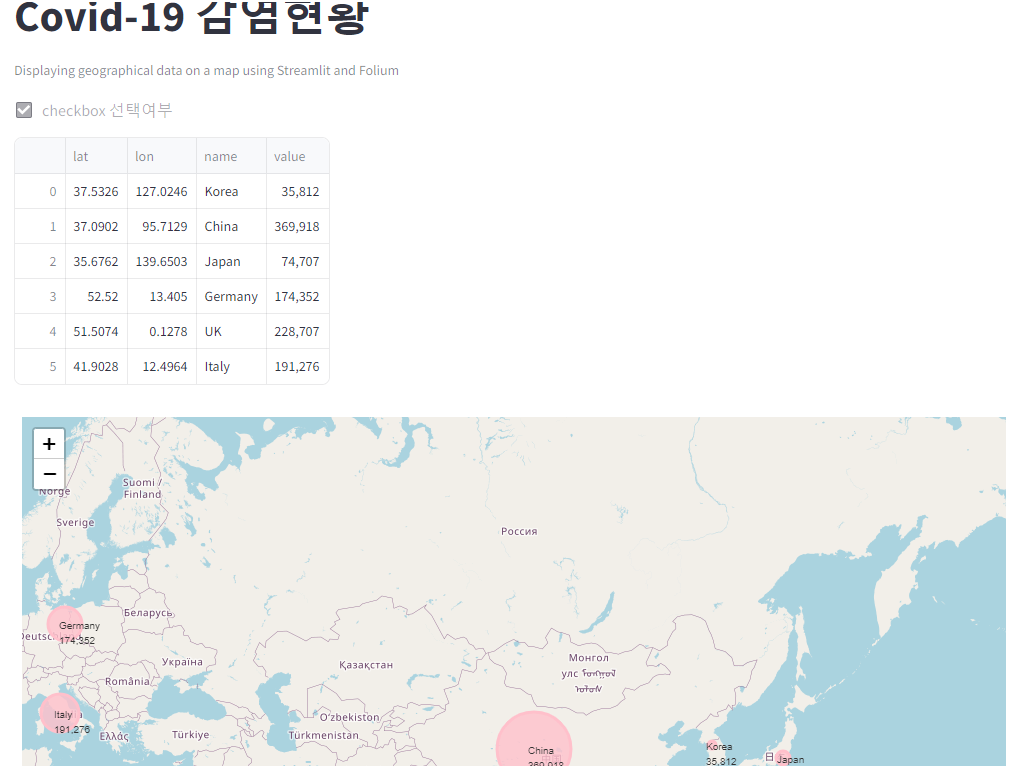
6. 다양한 Chart, Map 실습
728x90